
INTRODUCTION
The COVID-19 pandemic has had a significant impact on the world, affecting millions of people across the globe. In this project, I analyzed COVID-19 data using Microsoft Excel, SQL (BigQuery) and Power BI to understand the current state of the pandemic and its effects on various regions, with special attention to Canada
DATA SOURCE
The Data was sourced from reputable a data repository website called Our World in Data. Regular Data about important sectors of the world are constantly been upadated on the website (ourworldindata.org).The data included the Daily Covid-19 cases, Daily Vaccinated People, Daily Death Toll among other for all Countries ountries across the world.
DATA ANALYSIS
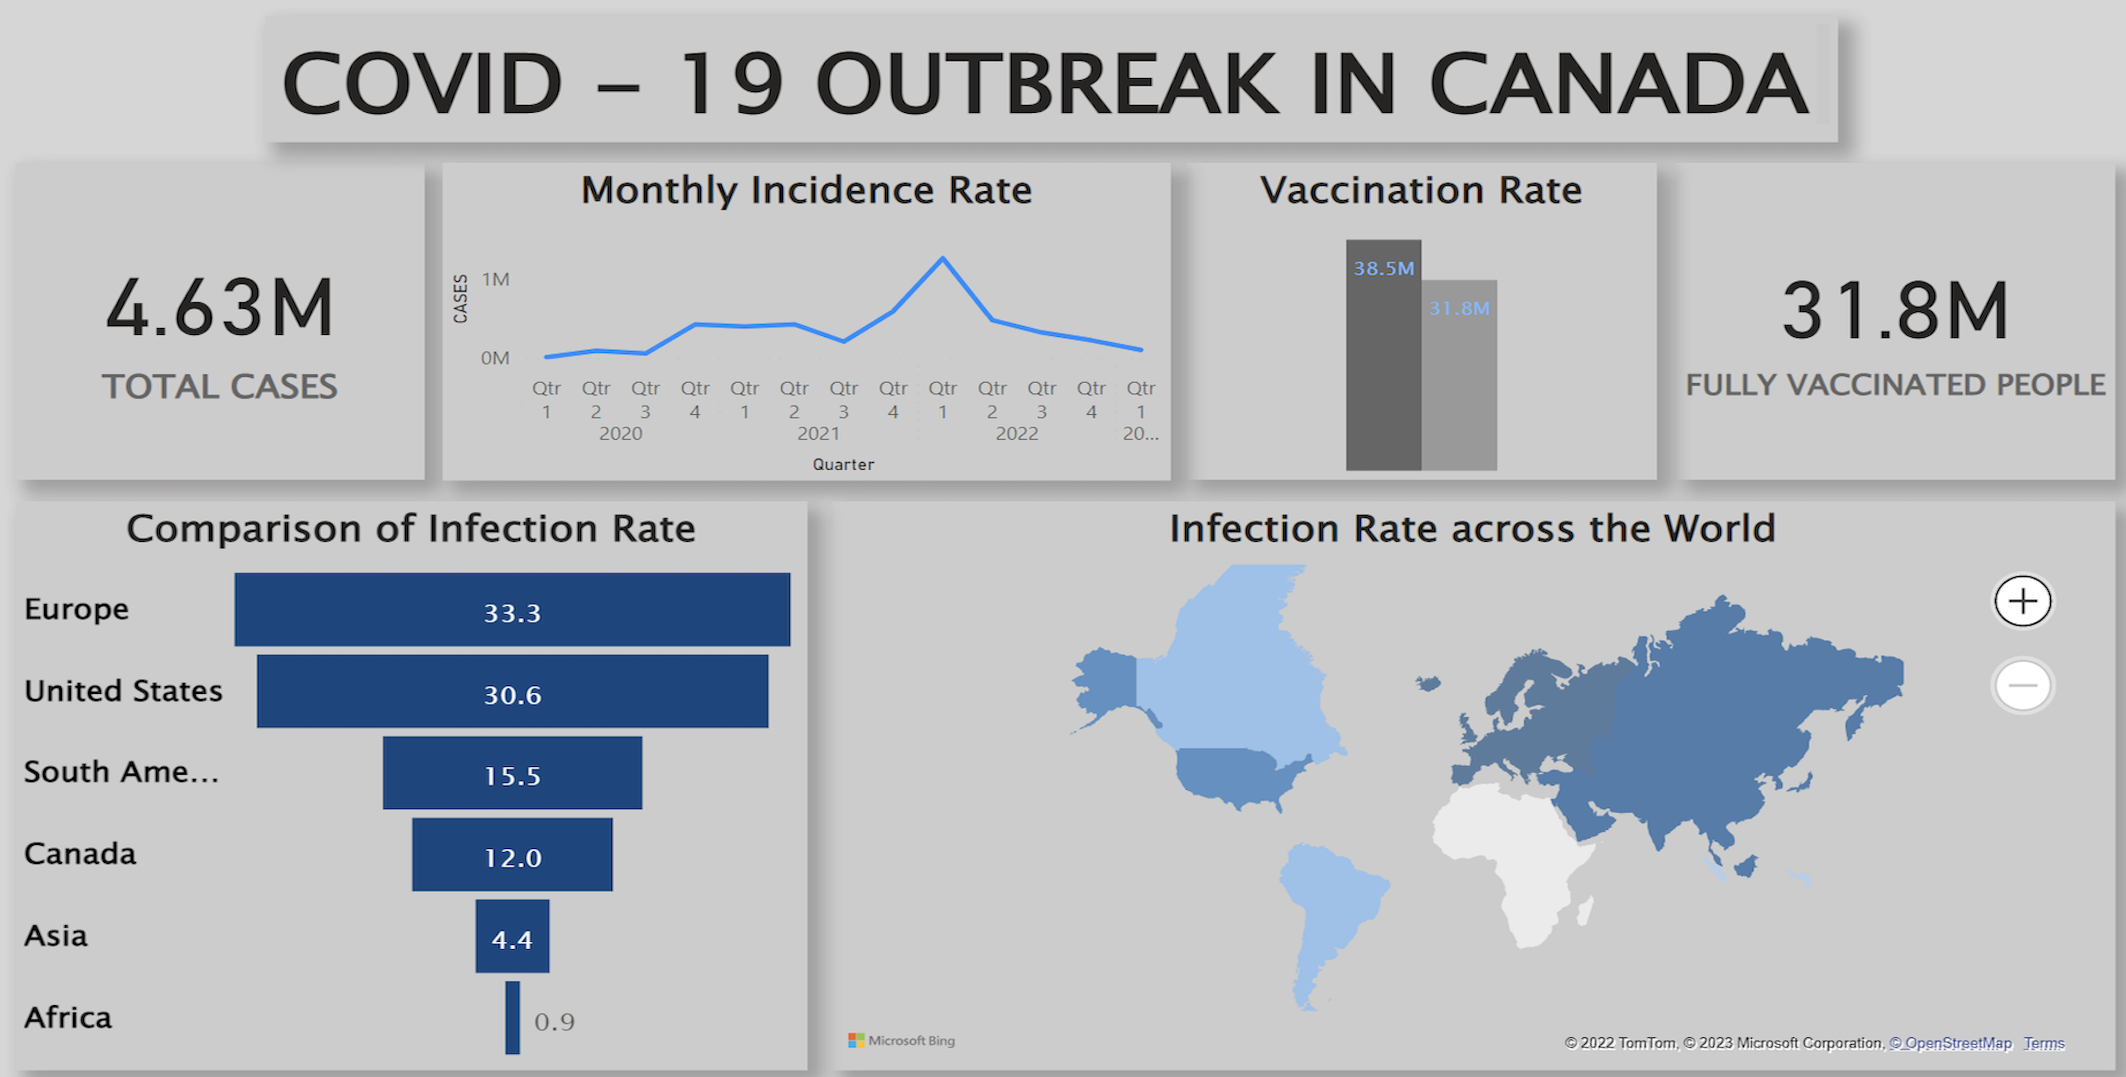
Various data analysis tools to analyze the data, including line graphs, bar graphs, funnel charts, and maps. The following are some of the insights I gained from our analysis:
- Total number of cases: The total number of COVID-19 cases globally has surpassed 438 million, with Canada accounting for 4.63 million of these cases.
- Total number of people vaccinated: The number of people who have received COVID-19 vaccinations globally has surpassed 6.2 billion, with 31.8 million people in Canada receiving at least one dose of the vaccine, which is over 80% of the eligible population.
- Quarterly incidence rate: The incidence rate of COVID-19 cases fluctuated over time, with some quarters showing a higher rate than others.
- Infection rate: We observed that Europe has an infection rate of 33.3%, followed by the United States at 30.6%, South America at 15.5%, Asia at 4.4%, and Africa at 0.8%.
- Canada's infection rate compared to other regions: Using a funnel chart, we compared Canada's infection rate to other regions and found that Canada's infection rate is relatively low compared to Europe and South America.
- Map of the world: Using a map, we visualized the infection rates across various regions of the world, and we found that the pandemic has affected some regions more severely than others.
CONCLUSION
In conclusion, our COVID-19 data analysis project revealed some critical insights into the current state of the pandemic. Our findings suggest that the pandemic's impact varies significantly across different regions of the world, and that vaccination rates play a crucial role in reducing the number of cases. We hope that our analysis can help inform public health policies and initiatives that will help combat the ongoing pandemic.